Young Yanks of the Week: The Methodology
In a given week, who were the players that most contributed to victory? We hear a lot from the media about some players, and snatches of highlights can tell us part of the story. Despite this, many performances go unnoticed or unheralded. Goals and assists only tell part of the story, and sometimes a player may score a goal but be not even close to the best player on the field. Even the Audi Index, which presumes to identify the highest performing players, is inscrutable and doesn't seem to truly identify who helped their teams win. That's why I'm attempting something else. I'm not a statistician or a graphic designer, so this is a work in progress, but I hope it will improve as time goes on.
First, massive props to American Soccer Analysis for their Goals Added (G+) Measurement. All the hard work is theirs. Read this article for a breakdown of what G+ is, and what it measures.
Second, read their article about the visualizations they've created. I am shamelessly stealing their colors, although the way I'm presenting it is a little different than the way they chose.
The Team:
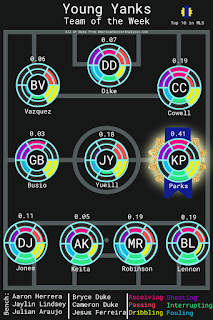
This team of the week is from the games on October 14. Not everyone plays every match day, but over the course of multiple weeks the best players should appear frequently. Positions are approximate and formations may shift to accommodate the best players.
The Radar:
The radar is a vital part of the information. The wheel is broken up into 10 sections. This represents Percentile Rank of performance in a specific area. For example, Gianluca Busio performed in the 90th percentile or higher in dribbling for the week represented. This was calculated by looking at roughly 2000 performances by players since the beginning of the second phase of MLS this season. That is the reason the yellow wedge extends to the edge.
The green wedge, which cannot be seen, represents interrupting. Busio's performance in this area was in the bottom 10th percentile. The middle circle represents the league median peformance, or 50th percentile. The hope is that at a glance you can see how the player made the biggest impact on the game.
The bars are calculated by rounding down, so a player in the 89th percentile would have up until the 80 mark highlighted.
Who is included, and Starters vs Bench:
To be eligible to make the team, players have to be born in 1997 or later, as this is the definition for the USA Olympic team. They also have to be eligible to represent the USA in international competition. If they are cap tied to another team, they are no longer eligible for the graph.
I had some difficulty deciding who to include in the top XI, especially since not every player plays a full game every week. Some players come off the bench to play well but it is more difficult to make an impact across . In the end, it may have to be a judgment call. In this match day, Caden Clark played very well off the bench and was one of the best performers of the match day, despite playing fewer than 20 minutes. I chose to include him as a starter. In general, unless a substitute's performance is remarkable they will be assigned to the bench.
Extras
For now, the only extra is the blue ribbon marking a top 10 player in all of MLS. The week above, Keaton Parks was the only one to make the top 10. I may add more marks as time goes on.
As always, comment below or find me on twitter @Thundering165 if you have questions or anything to add. Feedback is always welcome.


Comments
Post a Comment